BI Publisher Graph Values
I was writing a sales report to be published through BI Publisher (a.k.a. XML Publisher on our E-Business Suite), and in addition to a simple table of the sales numbers, I added in one of those nifty bar graphs. Oracle’s BI Publisher Desktop plugin for Word makes writing nice looking reports very easy (that is, once you have defined your data source, but that is another matter). So adding a bar graph to better illustrate those sales numbers was as simple as following the Template Builder Insert Chart wizard.
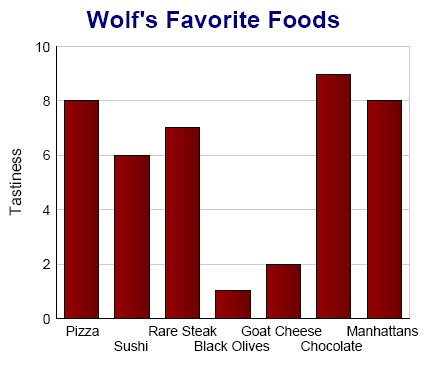
The report looked similar to this:

Nice! That plus a few more bits of data and the report was ready to publish. As great as the report looked, the initial management response was, “Wonderful, can we add actual values to the bars in the graph?”
I noticed that initially myself, but I did gloss over that detail. The sales reports were a lot more complex than my simple list of tasty foods. One could approximate values from the y-axis, but if the numbers were large enough it was a rough guess at best.
I looked through the Chart Wizard, my local BI Publisher documentation, the usually helpful BI Publisher Forum on the Oracle Technology Network, but to no avail. If the answer was there, I couldn’t find it. Finally, Google brought me to the excellent Tim Dexter Blog, where I found this post on Misbehavin’ Baa Chart Labels. Bingo, I discovered I was looking for: MarkerText.
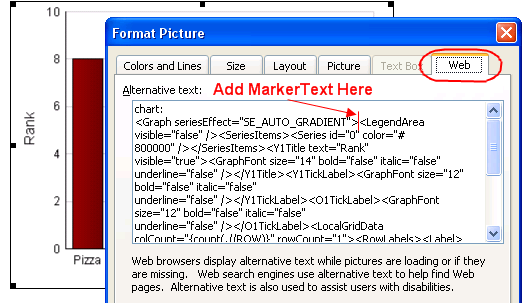
Charts inserted into RTF templates using the Word Template Builder toolbar use images as placeholders for chart size and location. Tucked away in the Web Properties of the image is the Oracle BI Beans DTD code that actually defines the chart. With care, you can fiddle with the DTD to create some really dazzling charts, far beyond the simple options listed in the wizard.
Here’s the recipe to display values in BI Publisher graphs. Double click the placeholder image to open the Word Format Picture dialog (but not to open the BI Publisher Chart properties dialog). Then select the Web tab. This is where you need to add some properties for MarkerText.

Here’s some sample MarkerText to add (there are many more options), right after the tag:
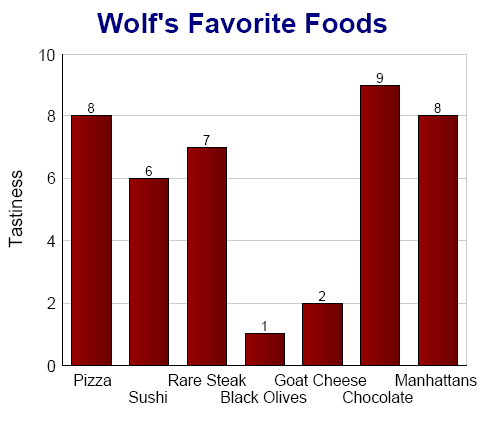
And the result:

There is much more one can do with MarkerText. We can change the font, angle, position and much more. Some good stuff can be found in Oracle’s documentation on DTD for Customizing Graphs in Oracle Reports.