That Report Isn’t Dense Enough
February 3, 2009
Recently I have written several SQL reports where there were just not enough rows. No, I wasn’t getting paid by the word, but the reports were misleading. Data is stored as a result of something happening, not when something doesn’t happen. Sometimes those missing rows are very interesting clues to business performance.
Adding missing rows is called data densification. For example, a purchasing report might show item and quantity levels for a given period, and the transactions that affected inventory within that period. If the month end inventory for a normally popular item is sufficient, but sales were low, that would be interesting. However, knowing that for 15 days of the month there were none available to sell which may have caused the low sales would be insightful.
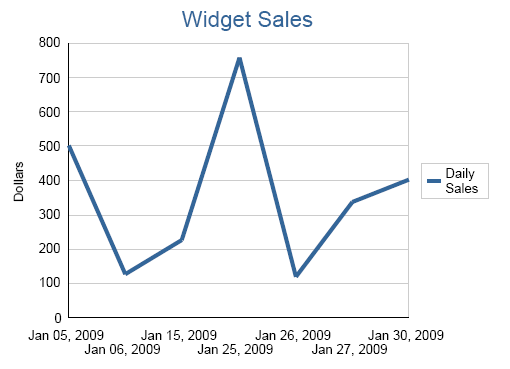
In my most recent need for densification, a monthly sales line graph showed some sales variation throughout the month. However, the graph showed consistent sales.
That sales report is based on a SQL statement similar to this, which returns the total sales for each day:
SELECT TO_CHAR (sales_date, 'Mon DD, YYYY') sales_date,
       SUM (quantity * price) total_sales
  FROM sparse_sales
 WHERE sales_date BETWEEN to_date ('01-JAN-09', 'DD-MON-YY') AND to_date ('31-JAN-09', 'DD-MON-YY') +.99999
GROUP BY TO_CHAR (sales_date, 'Mon DD, YYYY')
ORDER BY sales_date;
Output:
| SALES_DATE | TOTAL_SALES |
|---|---|
| Jan 05, 2009 | 502.5 |
| Jan 06, 2009 | 125 |
| Jan 15, 2009 | 225 |
| Jan 25, 2009 | 758.75 |
| Jan 26, 2009 | 120 |
| Jan 27, 2009 | 337.5 |
| Jan 30, 2009 | 402 |
What about all those days between actual sales? How do we select something that isn’t there?
The answer is an outer join to another, unrelated table to fill in the missing rows. The E-Business Suite I support has a bom_calendar_dates table that I often use to densify sales data. It’s simply a list of consequtive dates for the next 50 years. If the database you are reporting from does not have a dates table, you might consider creating one for densification as well. Here’s a simple script to create a dates table in your schema of choice: Dates Table (Edit: If creating a database object is not an option for you, then you can use a row generator to accomplish the same thing. In fact, I now think this is preferable. Check out my updated post: An All SQL Option to Densifying Dates.)
First, we’re going to select the same report date range from our new calendar table:
SELECT c.dates
  FROM calendar c
 WHERE c.dates BETWEEN to_date ('01-JAN-09', 'DD-MON-YY') AND to_date ('31-JAN-09', 'DD-MON-YY');
Next, LEFT OUTER JOIN our original sales data (as an inline query) to the set of rows provided from the calendar table. A NVL() function will supply any missing sales numbers (using zero as the null value). I also replaced the date format mask with TRUNC() in the SELECT and GROUP BY clauses to allow for a clean join to the calendar dates column.
 SELECT TO_CHAR (c.dates, 'Mon DD, YYYY') sales_date,
       NVL (s.total_sales,0) total_sales
  FROM calendar c
  LEFT OUTER JOIN (SELECT TRUNC (sales_date) sales_date,
                          SUM (quantity * price) total_sales
                     FROM sparse_sales
                    WHERE sales_date BETWEEN to_date ('01-JAN-09', 'DD-MON-YY') AND to_date ('31-JAN-09', 'DD-MON-YY') +.99999
                  GROUP BY TRUNC (sales_date)) s ON c.dates = s.sales_date
 WHERE c.dates BETWEEN to_date ('01-JAN-09', 'DD-MON-YY') AND to_date ('31-JAN-09', 'DD-MON-YY')
ORDER BY c.dates;
Now our output shows a more complete picture:
| SALES_DATE | TOTAL_SALES |
|---|---|
| Jan 01, 2009 | 0 |
| Jan 02, 2009 | 0 |
| Jan 03, 2009 | 0 |
| Jan 04, 2009 | 0 |
| Jan 05, 2009 | 502.5 |
| Jan 06, 2009 | 125 |
| Jan 07, 2009 | 0 |
| Jan 08, 2009 | 0 |
| Jan 09, 2009 | 0 |
| Jan 10, 2009 | 0 |
| Jan 11, 2009 | 0 |
| Jan 12, 2009 | 0 |
| Jan 13, 2009 | 0 |
| Jan 14, 2009 | 0 |
| Jan 15, 2009 | 225 |
| Jan 16, 2009 | 0 |
| Jan 17, 2009 | 0 |
| Jan 18, 2009 | 0 |
| Jan 19, 2009 | 0 |
| Jan 20, 2009 | 0 |
| Jan 21, 2009 | 0 |
| Jan 22, 2009 | 0 |
| Jan 23, 2009 | 0 |
| Jan 24, 2009 | 0 |
| Jan 25, 2009 | 758.75 |
| Jan 26, 2009 | 120 |
| Jan 27, 2009 | 337.5 |
| Jan 28, 2009 | 0 |
| Jan 29, 2009 | 0 |
| Jan 30, 2009 | 402 |
| Jan 31, 2009 | 0 |
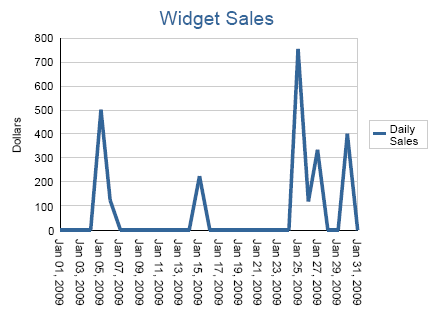
For several weeks sales were flat with increasing activity at the end of the month. Although this technique is most often applied to sparse dates, it can also be used to fill in missing number sequences as well. For some reports you may need to repeat the densification across some subset, such as for a set of products. For this a partition outer join is just the ticket, but that is material for another post.